Function to show how the power to detect change varies with the error rate.
powerPlot.RdFunction to show how the power to detect change varies with the error rate.
Value
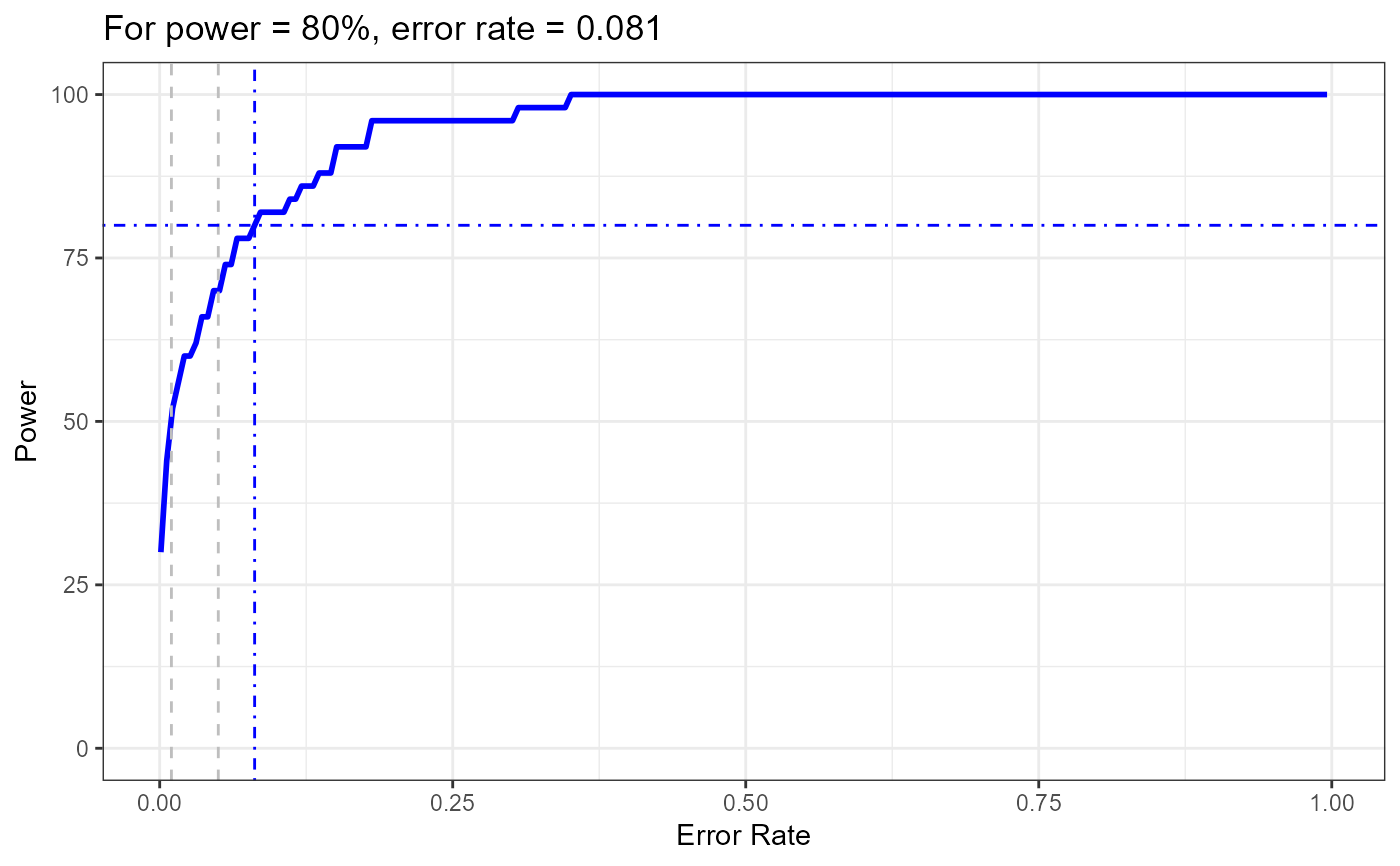
Plot showing how the power to detect change varies with increasing error rate. The first grey dashed line is at 1% and the second at 5%, traditionally values used as p-value cutoffs. The blue dashed lines indicate the error rate required to get a power of 80%. This value is given in the title.