Plot partial plots for each of the variables listed in factorlist.in or varlist.in.
Source: R/runPartialPlots.R
runPartialPlots.RdPlot partial plots for each of the variables listed in factorlist.in or varlist.in.
Usage
runPartialPlots(
  model,
  data,
  factorlist.in = NULL,
  varlist.in = NULL,
  showKnots = FALSE,
  type = "response",
  partial.resid = FALSE,
  save = FALSE,
  savedata = F,
  label = NULL,
  includeB0 = FALSE
)
Arguments
- model
Fitted model object (glm or gam)
- data
Data frame of data information used to fit
model- factorlist.in
(
default=NULL). Vector or names of factor variables- varlist.in
(
default=NULL). Vector of names of continuous variables- showKnots
(
default=FALSE). Logical stating whether knot locations should be plotted.- type
(
default='responss'). Character stating whether to return partial plots on the scale of the link function or the response.- partial.resid
(
default=FALSE). Logical stating whether to include partial residuals on the plot.- save
(
default=FALSE). Logical stating whether plot should be saved into working directory.- savedata
(
default=FALSE). Logical stating whether the data used to make the plots should be saved into the working directory. The object is called PartialData_'variablename'.RData- label
(
default=NULL). This enables the user to specify a character label for the plots saved to the working directory. This may also be used to specify an alternative directory.- includeB0
(
default=TRUE). Logical stating whether to include the intercept in the partial plots.
Examples
#' # load data
data(ns.data.re)
model<-gamMRSea(birds ~ observationhour + as.factor(floodebb) + as.factor(impact),
family='quasipoisson', data=ns.data.re)
runPartialPlots(model, ns.data.re, factorlist.in=c('floodebb', 'impact'),
varlist.in=c('observationhour'))
#> [1] "Making partial plots"


 runPartialPlots(model, ns.data.re, factorlist.in=c('floodebb', 'impact'),
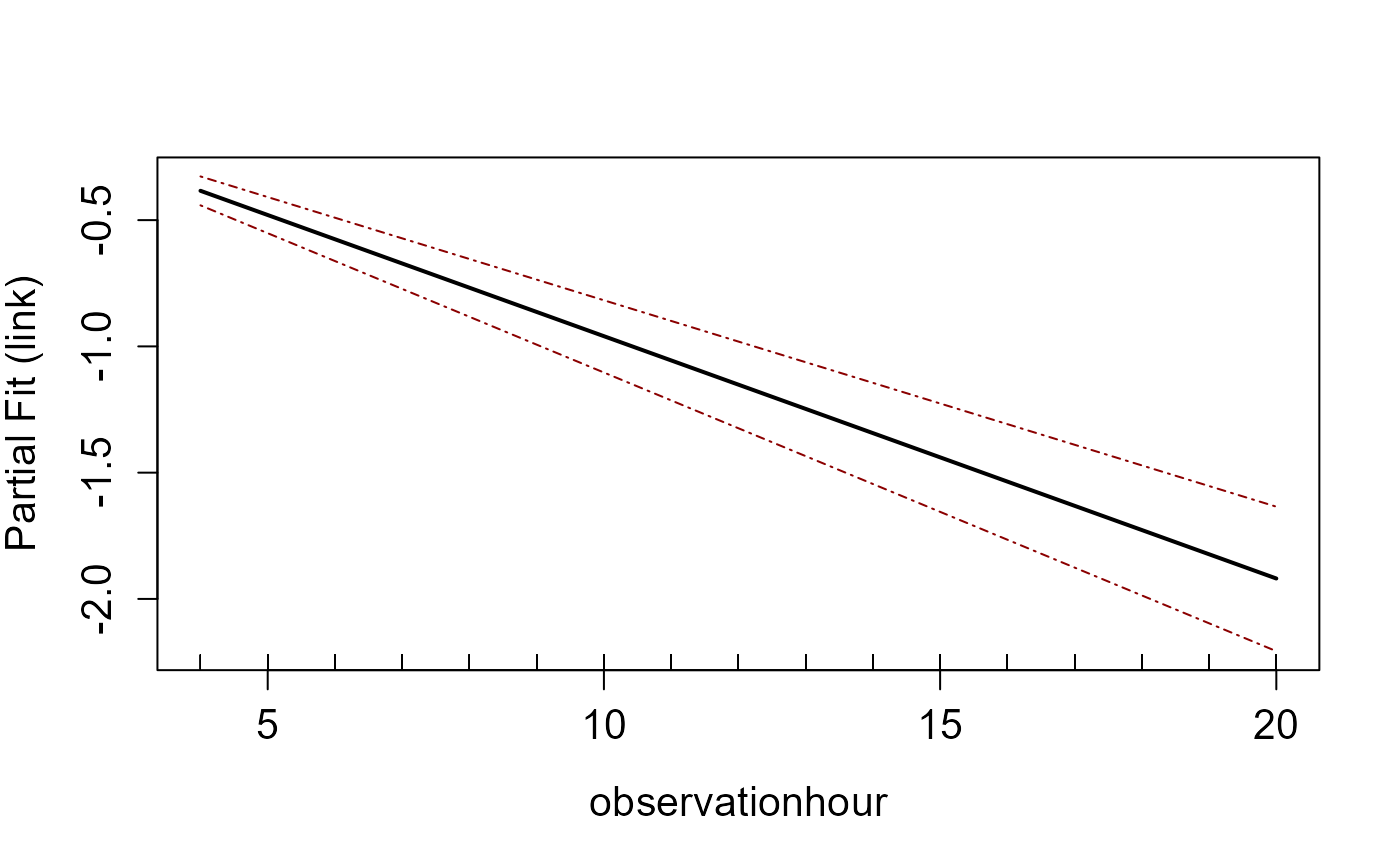
varlist.in=c('observationhour'), type='link')
#> [1] "Making partial plots"
runPartialPlots(model, ns.data.re, factorlist.in=c('floodebb', 'impact'),
varlist.in=c('observationhour'), type='link')
#> [1] "Making partial plots"


 runPartialPlots(model, ns.data.re, factorlist.in=c('floodebb', 'impact'),
varlist.in=c('observationhour'), partial.resid=TRUE)
#> [1] "Making partial plots"
#> Error in predict.gamMRSea(object, type = "terms"): argument "object" is missing, with no default
runPartialPlots(model, ns.data.re, factorlist.in=c('floodebb', 'impact'),
varlist.in=c('observationhour'), partial.resid=TRUE)
#> [1] "Making partial plots"
#> Error in predict.gamMRSea(object, type = "terms"): argument "object" is missing, with no default